The Schaeffler diagram is an important tool for predicting the constitution of your stainless steel weld deposits. Depending on the alloying elements present in the weldment, the Schaeffler diagram gives predictions about the various phases (structures) present in the weld.
‘Constitution diagrams’ such as the Schaeffler diagram is very helpful in such situations to accurately predict the ferrite level in the weld deposit based on the chemical composition.
This prediction is based on the ferrite and austenitic stabilizers present in the weldment. Schaeffler’s diagram is useful in estimating the microstructure of the weld deposit and the filler metal composition required to produce the prescribed amount of ferrite in the weld deposit.
The chromium equivalent (Drawn on the horizontal line) is calculated from the weight percentage of ferrite-forming elements (Cr, Si, Mo, Nb, W) and the nickel equivalent (drawn on the vertical line) is calculated from the weight percentage of austenite-forming elements (C, Ni, Mn, Cu, N).
The position in the Schaeffler diagram defined by the Cr- and Ni-equivalents gives the proportions of martensite, austenite, and ferrite in the resulting microstructure.
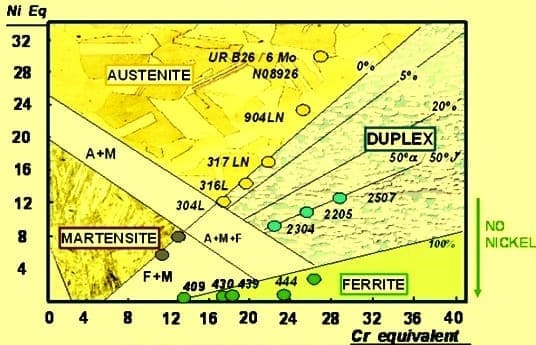
Figure 1. Microstructures plotted on Schaeffler Diagram
Nickel Equivalent (Ni-Eq) & Chromium Equivalent (Cr-Eq) Formula
A Schaeffler diagram can be used to show the influence of the proportion of two alloying elements (and therefore the composition of the alloy) on the structure achieved after fast cooling from 1050°C to room temperature.
The diagram shows how the microstructure of the weld is affected by the alloying elements in the stainless steel, base don those like Nickel (Ni- austenitic stabilizer) and those act like Chromium (Cr- Ferrite stabilizer).
The Nickel equivalent (Ni- Eq) group includes Ni and the effect of C and Mn. Chromium Equivalent (Cr-Eq) includes the effects of Cr, Mo, Si, and Cb. To estimate the microstructure of a deposit the Cr and Ni Equivalents are calculated using the following equations:
• Cr equivalent Formula = %Cr + %Mo + 1.5(%Si) + 0.5(%Cb) • Ni equivalent Formula = (%Ni)+30(%C+%N)+0.5(Mn+%Cu+%Co)
The Schaeffler diagram is very useful for austenitic base weld metals to predict the final deposit weld structure. Below Schaeffler Diagram shows the positions of various welding consumables with their respective weld deposit microstructure.
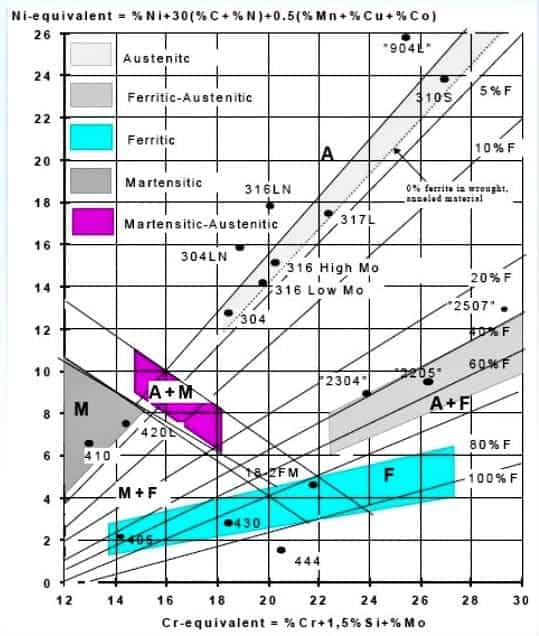
Figure 2. Most common welding electrode metallurgy on Schaeffler Diagram
A practical example for Schaeffler Diagram for Dissimilar Welding
As we learned that the position of the weld microstructure in the Schaeffler diagram is located using the Cr-Eq and Ni-Eq of the base metals. The value obtained is marked on the coordinates of the diagram and a point is located. The microstructure of the point is the one predicted for a deposit of that composition.
It is possible to plot the composition of the filler wire and the composition of the base metal and connect them with a line and the resulting weld would be along the line. By the use of the Schaeffler Diagram, it is possible to select a filler metal that will avoid ferrite or martensite, as desired in the stainless steel weld deposit.
The Schaeffler Diagram can also be used to predict the composition of the weld deposit when welding dissimilar stainless steel materials.
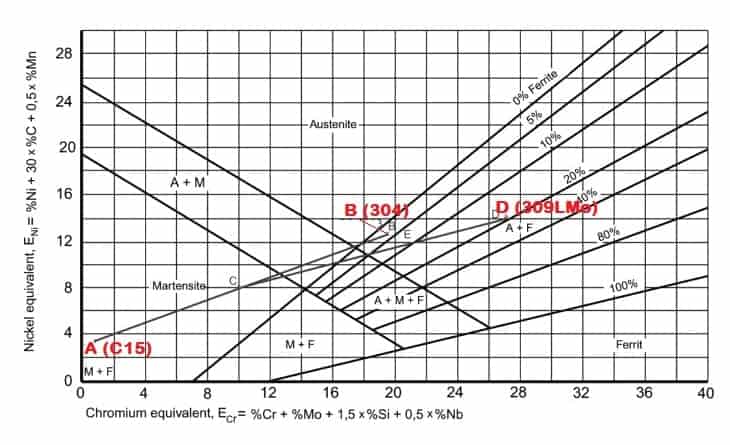
The Schaeffler diagram in the above Figure represents an example of the above for the case of a low-alloy steel grade C15 (EN 1.0401), (A), being welded to stainless steel AISI 304 (1.4301), (B), using ER309LMo (ER 23 12 2 L) filler wire (D).
It has been found that micro-fissuring does not occur when the austenitic weld-metal has about 3 to 5% ferrite in its microstructure. The practice generally followed is, therefore, to select the filler metal composition in such a way that the deposited weld-metal has a duplex structure of austenite-ferrite.
To determine the amount of ferrite that will be formed in the austenitic weld-metal of a given composition, use is made of the Schaeffler diagram.
Figure 3. Distribution of phases on Schaeffler Diagram
In this diagram, the nickel equivalent is plotted on the ordinate or vertical axis, and the chromium equivalent on the abscissa or horizontal axis. The nickel equivalent is calculated by using the formula given in the figure, which uses the weight percentages of the common austenite stabilizing elements nickel, carbon, and manganese.
The chromium equivalent is similarly calculated using the formula is given, which is derived from the weight percentages of common ferrite stabilizers chromium, molybdenum, silicon, and columbium.
The series of dark lines in the diagram demarcate the zones of weld-metal microstructures. The figure also indicates the positions of various standard weld-metals in the diagram. For example, E 310 weld-metal is indicated as being fully austenitic, while E308 weld-metal is shown to be having a duplex structure with 5-7% ferrite.
Stainless Steel Phase Diagram
A phase diagram is a graphical representation of the different phases that occur during the heating or cooling of a material. The stainless steel phase diagram is a tool that can be used to understand the behavior of this metal during different heat treatment processes.
The most important aspect of the phase diagram is the line that divides the solid and liquid phases. This line is known as the melting point.
The melting point of stainless steel is between 2550 and 2785°F. Above this temperature, the metal is in a liquid state. Below this temperature, the metal is in a solid state.
The second important aspect of the phase diagram is the line that divides the austenite and ferrite phases. This line is known as the transformation temperature.
The transformation temperature of stainless steel is between 1400 and 1600 degrees Fahrenheit depending on the stainless steel grade. Above this temperature, the metal is in an austenitic state.
Material Welding is run by highly experienced welding engineers, welding trainers & ASNT NDT Level III bloggers.
We strive to provide most accurate and practical knowledge in welding, metallurgy, NDT and Engineering domains.