Surface Finishes Chart
A surface finishes chart is a tool used to compare and reference the different levels of surface finish that can be achieved on a material.
The surface finishes chart typically includes a range of surface finishes, represented by a series of numbers, letters, or symbols, that correspond to specific roughness values or other parameters.
The roughness values are often measured in micro-meters (µm) or microns, and they represent the average deviation of the surface profile from its mean line.
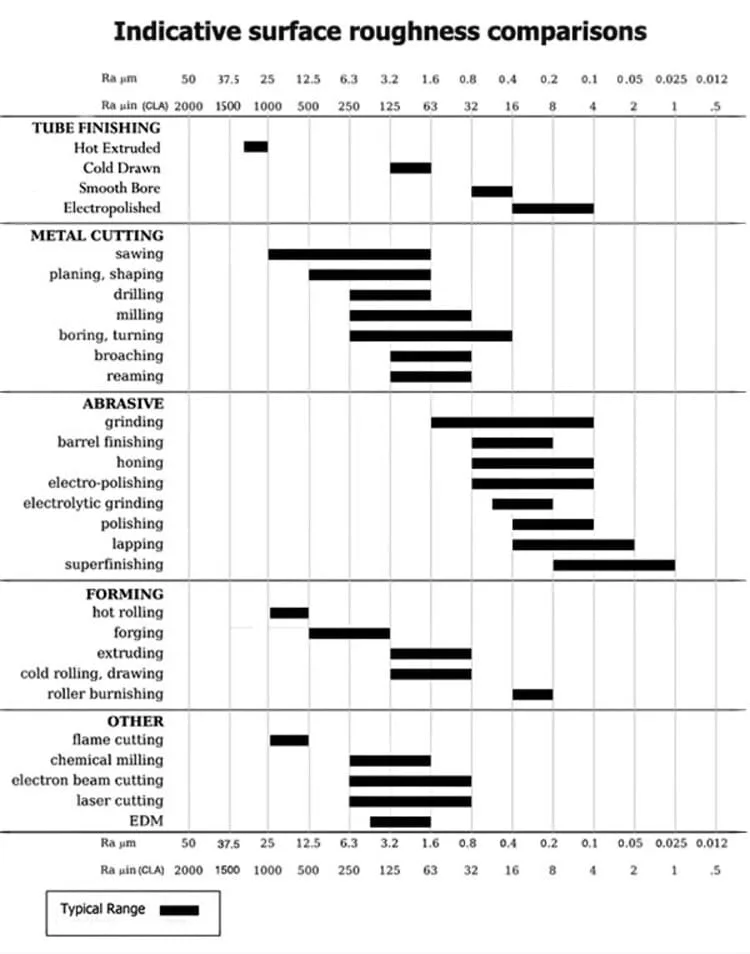
Below is an example of Surface finishes chart highlighting the surface finish roughness of different material manufacturing processes.
Importance of Surface Finishes in Engineering
Surface finish, also known as surface roughness or surface texture, is an important characteristic of a surface that can affect the performance and functionality of a product in several ways. Some of the key reasons why surface finish is important include:
- Friction and wear: A smooth surface finish can reduce friction between two surfaces in contact, making it easier to move or slide one surface against the other. A rough surface finish, on the other hand, can increase friction and wear, making it harder to move or slide one surface against the other.
- Aesthetics: Surface finish can affect the appearance of a product. A smooth surface finish can make a product look polished and high-quality, while a rough surface finish can make a product look rough and unfinished.
- Functionality: Surface finish can affect the functionality of a product. In applications such as optical or precision machining, a smooth surface finish is often required to reduce glare and improve visibility. In other applications, such as aerospace and automotive, a rough surface finish may be desired to improve durability and reduce the risk of wear and tear.
- Cleanability: The surface finish can affect the ease of cleaning a product, a smooth surface finish is often easier to clean than a rough surface finish.
- Corrosion resistance: Surface finish can also affect the corrosion resistance of a material, a smooth surface finish often providing better corrosion resistance than a rough surface finish.
- Reflectivity: Surface finish can also affect the reflectivity of a surface. A smooth surface finish can provide better reflectivity than a rough surface finish, which can be important in optical or electronic applications.
What is Surface Finish?
Surface roughness, also known as surface texture or surface finish, is a measure of the deviation of a surface from a perfect, smooth surface.
It is defined as the deviation of the surface profile from its mean line, often measured in micro-meters (µm) or microns.
Surface roughness quantifies the small, repeating surface features that make up the surface of a material, and it can be affected by factors such as the manufacturing process, the tooling and equipment used, and the properties of the material.
It can be described using a parameter called Ra which is the arithmetic average of the roughness profile height deviations.
Characteristics of Surface Finish
Surface roughness can be characterized in several ways, depending on the application and the desired properties of the surface.
It is a multi-faceted parameter that encompasses different aspects of the surface, such as roughness height, roughness spacing, and roughness geometry.
Roughness height: The height of the asperities (peaks and valleys) relative to the average surface level.
Roughness spacing: The distance between the asperities, often characterized by the wavelength of the roughness.
Roughness geometry: The shape of the asperities, often characterized by the skewness, kurtosis, and other parameters of the roughness profile.
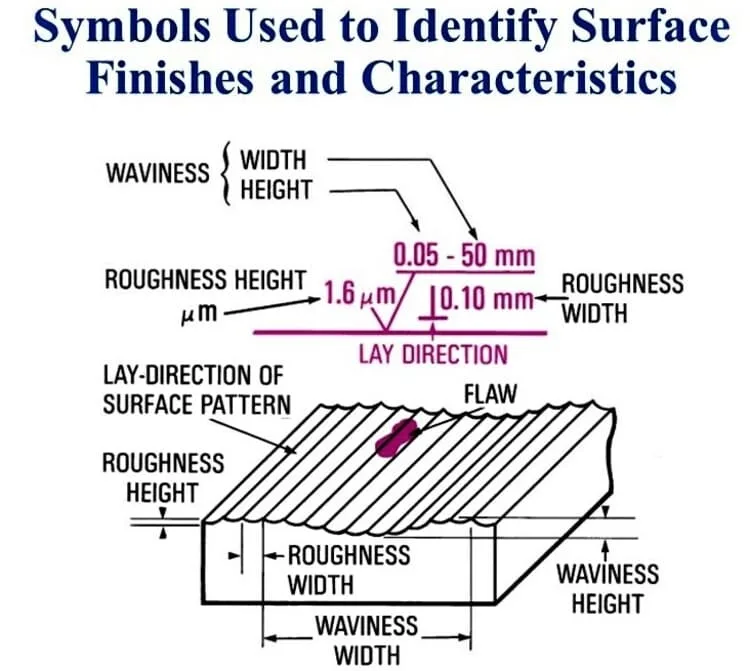
Roughness width: Roughness width, also known as the wavelength or spacing of the surface roughness, is a measure of the distance between the repeating surface features. It is typically measured in micrometers (µm) or nanometers (nm), and it is a key parameter that affects the overall surface roughness.
Waviness height: refers to the deviation of a surface from a perfect, smooth surface due to large-scale, from the lowest point to the highest point in a specific area.
How to Measure Surface Roughness?
There are several ways to measure surface roughness, but the most common methods are:
Contact profilometry
Contact profilometry is a method that uses a small stylus or probe that physically contacts the surface to measure the roughness.
The stylus or probe is moved across the surface, and the measurements are taken as the stylus or probe moves up and down over the surface features. Contact profilometry is often used for measuring surfaces that are too large or too complex to measure using non-contact methods.
Non-contact profilometry
Non-contact profilometry is a method that uses optical or laser technology to measure the roughness of a surface without physically contacting it.
The measurements are taken as the device scans the surface. Non-contact profilometry is often used for measuring small or delicate surfaces, or for measuring surfaces that are too large to measure using contact methods.
Stylus profilometry
This method uses a stylus that is in contact with the surface to measure its roughness. The stylus is dragged along the surface, and the sensor measures the vertical displacement of the stylus as it moves along.
This method is very common for laboratory measurements, although it can also be adapted for in-situ measurements, but it can be sensitive to the material properties and the environment, like humidity and temperature.
Optical profilometry
This method uses a camera, laser or white light to scan the surface and measure its roughness. The sensor captures the topography of the surface and creates a 3D model of it, that can be further analyzed to extract roughness parameters.
This method is commonly used for complex surfaces, non-homogenous surfaces, and in-situ measurements.
Interferometry
This method uses the interference of light waves to measure the roughness of a surface. It can be used for very smooth surfaces and can measure surface roughness at the nanometer level.
Measurement of Surface roughness using a Dial gauge
Dial gauges use a small stylus or probe that physically contacts the surface to take measurements.
The stylus or probe is moved across the surface, and the measurements are taken as the stylus or probe moves up and down over the surface features.
The measurements are then displayed on a dial, which allows for easy and accurate reading.
To measure surface roughness using a dial gauge, the following steps can be followed:
- Calibrate the dial gauge: The dial gauge should be calibrated to ensure that it is providing accurate measurements. This can be done by measuring a known surface and comparing the readings to the known values.
- Position the stylus: Position the stylus of the dial gauge onto the surface that you wish to measure. Make sure that the stylus is perpendicular to the surface and that it is in contact with the surface at all times during the measurement.
- Take readings: Slowly move the dial gauge across the surface, taking readings as you go. It’s recommended to use a traverse path to ensure that the measurement is done on the whole surface.
- Record measurements: Record the measurements in a chart or spreadsheet, noting the location and value of each reading.
- Analyze the data: Analyze the data and calculate the average roughness value of the surface. This can be done using a variety of roughness parameters such as Ra, Rt, Rz or Rq.
It’s important to note that dial gauges can be sensitive to the operator and the environment, taking care of the temperature and humidity variations, and maintaining the instrument in good condition can reduce the measurement errors.
Also, it’s recommended to use standards for the measurement, to compare and make sure that the measurement is accurate.
How to Measure Surface Roughness with Profilometer?
A profilometer is a device that can measure surface roughness by analyzing the profile of a surface. Here are the general steps to measure surface roughness with a profilometer:
- Place the profilometer on the surface to be measured.
- Move the profilometer across the surface while it takes multiple measurements of the surface profile.
- Profilometer will create a roughness profile, which displays the surface roughness in the form of peaks and valleys.
- Using the roughness profile, a variety of parameters such as Ra, Rq, Rz can be calculated to quantitatively describe the roughness of the surface.
There are many different types of profilometers, each with its own specific method of operation, so the exact steps may vary depending on the specific device being used.
Surface Roughness Chart Symbols and Abbreviations
The most important surface roughness chart symbols and abbreviations are listed below:
- Ra (Average Surface Roughness): This is the most common parameter used to describe surface roughness. It is the arithmetic average of the roughness profile, which is measured over a prescribed sampling length.
- Rz (Average Maximum Height of the Profile): Rz is another parameter that describes surface roughness. It is the average of the five highest peaks and five deepest valleys of the roughness profile, measured over a prescribed sampling length.
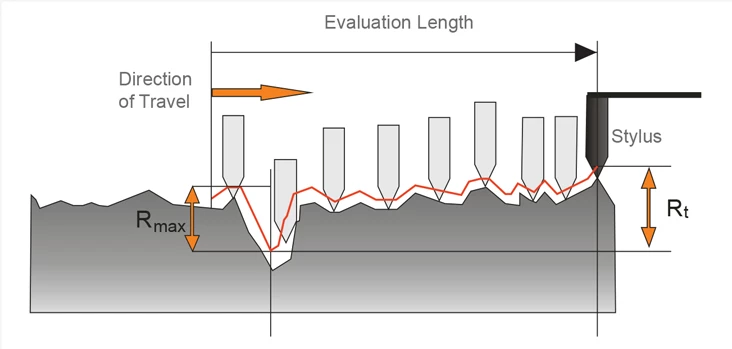
- Rmax (Vertical Distance from Peak to Valley): This parameter is the largest single deviation in the entire roughness profile, measured over the entire sampling length.
- CLA (Center Line Average): The Center Line Average (CLA) is a measure of the average height of the roughness profile. It is the average of the absolute values of the deviations from the center line of the roughness profile.
- Rt (Roughness Total): This parameter is the total of the absolute values of the roughness profile deviations, measured over a prescribed sampling length.
- Cut-off Length: Length Required for Sample: It is the length of the sample where roughness measurement is taken. Cut-off length can vary based on the type of material, surface condition, and measurement resolution.
These are some standard parameters to measure the surface roughness and these parameters are used in many industries like Automotive, aerospace, manufacturing etc to ensure the quality of product surface.
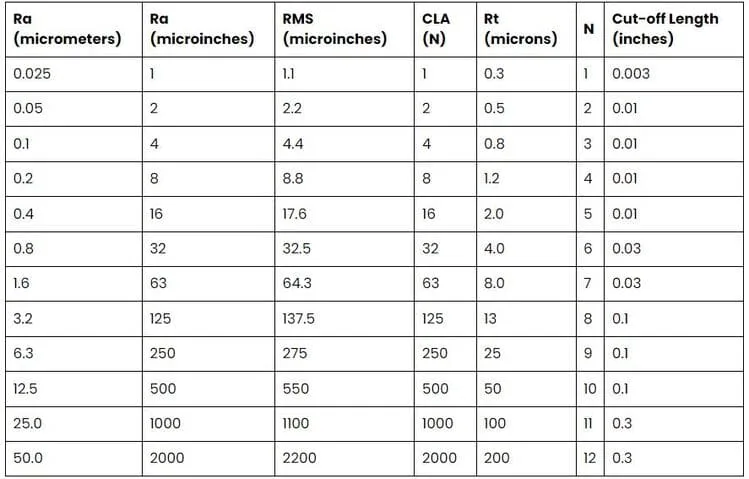
Surface Finish Conversion Chart
Surface Finish Conversion Chart is given below for reference.